Schedule grid and Gantt
Build and maintain a CPM schedule with the logic showing.
Forward and backward pass CPM, with total float, free float, driving links, constraints, calendars and a predecessor language — under a grid that keeps up with typing on schedules of a thousand activities and more.
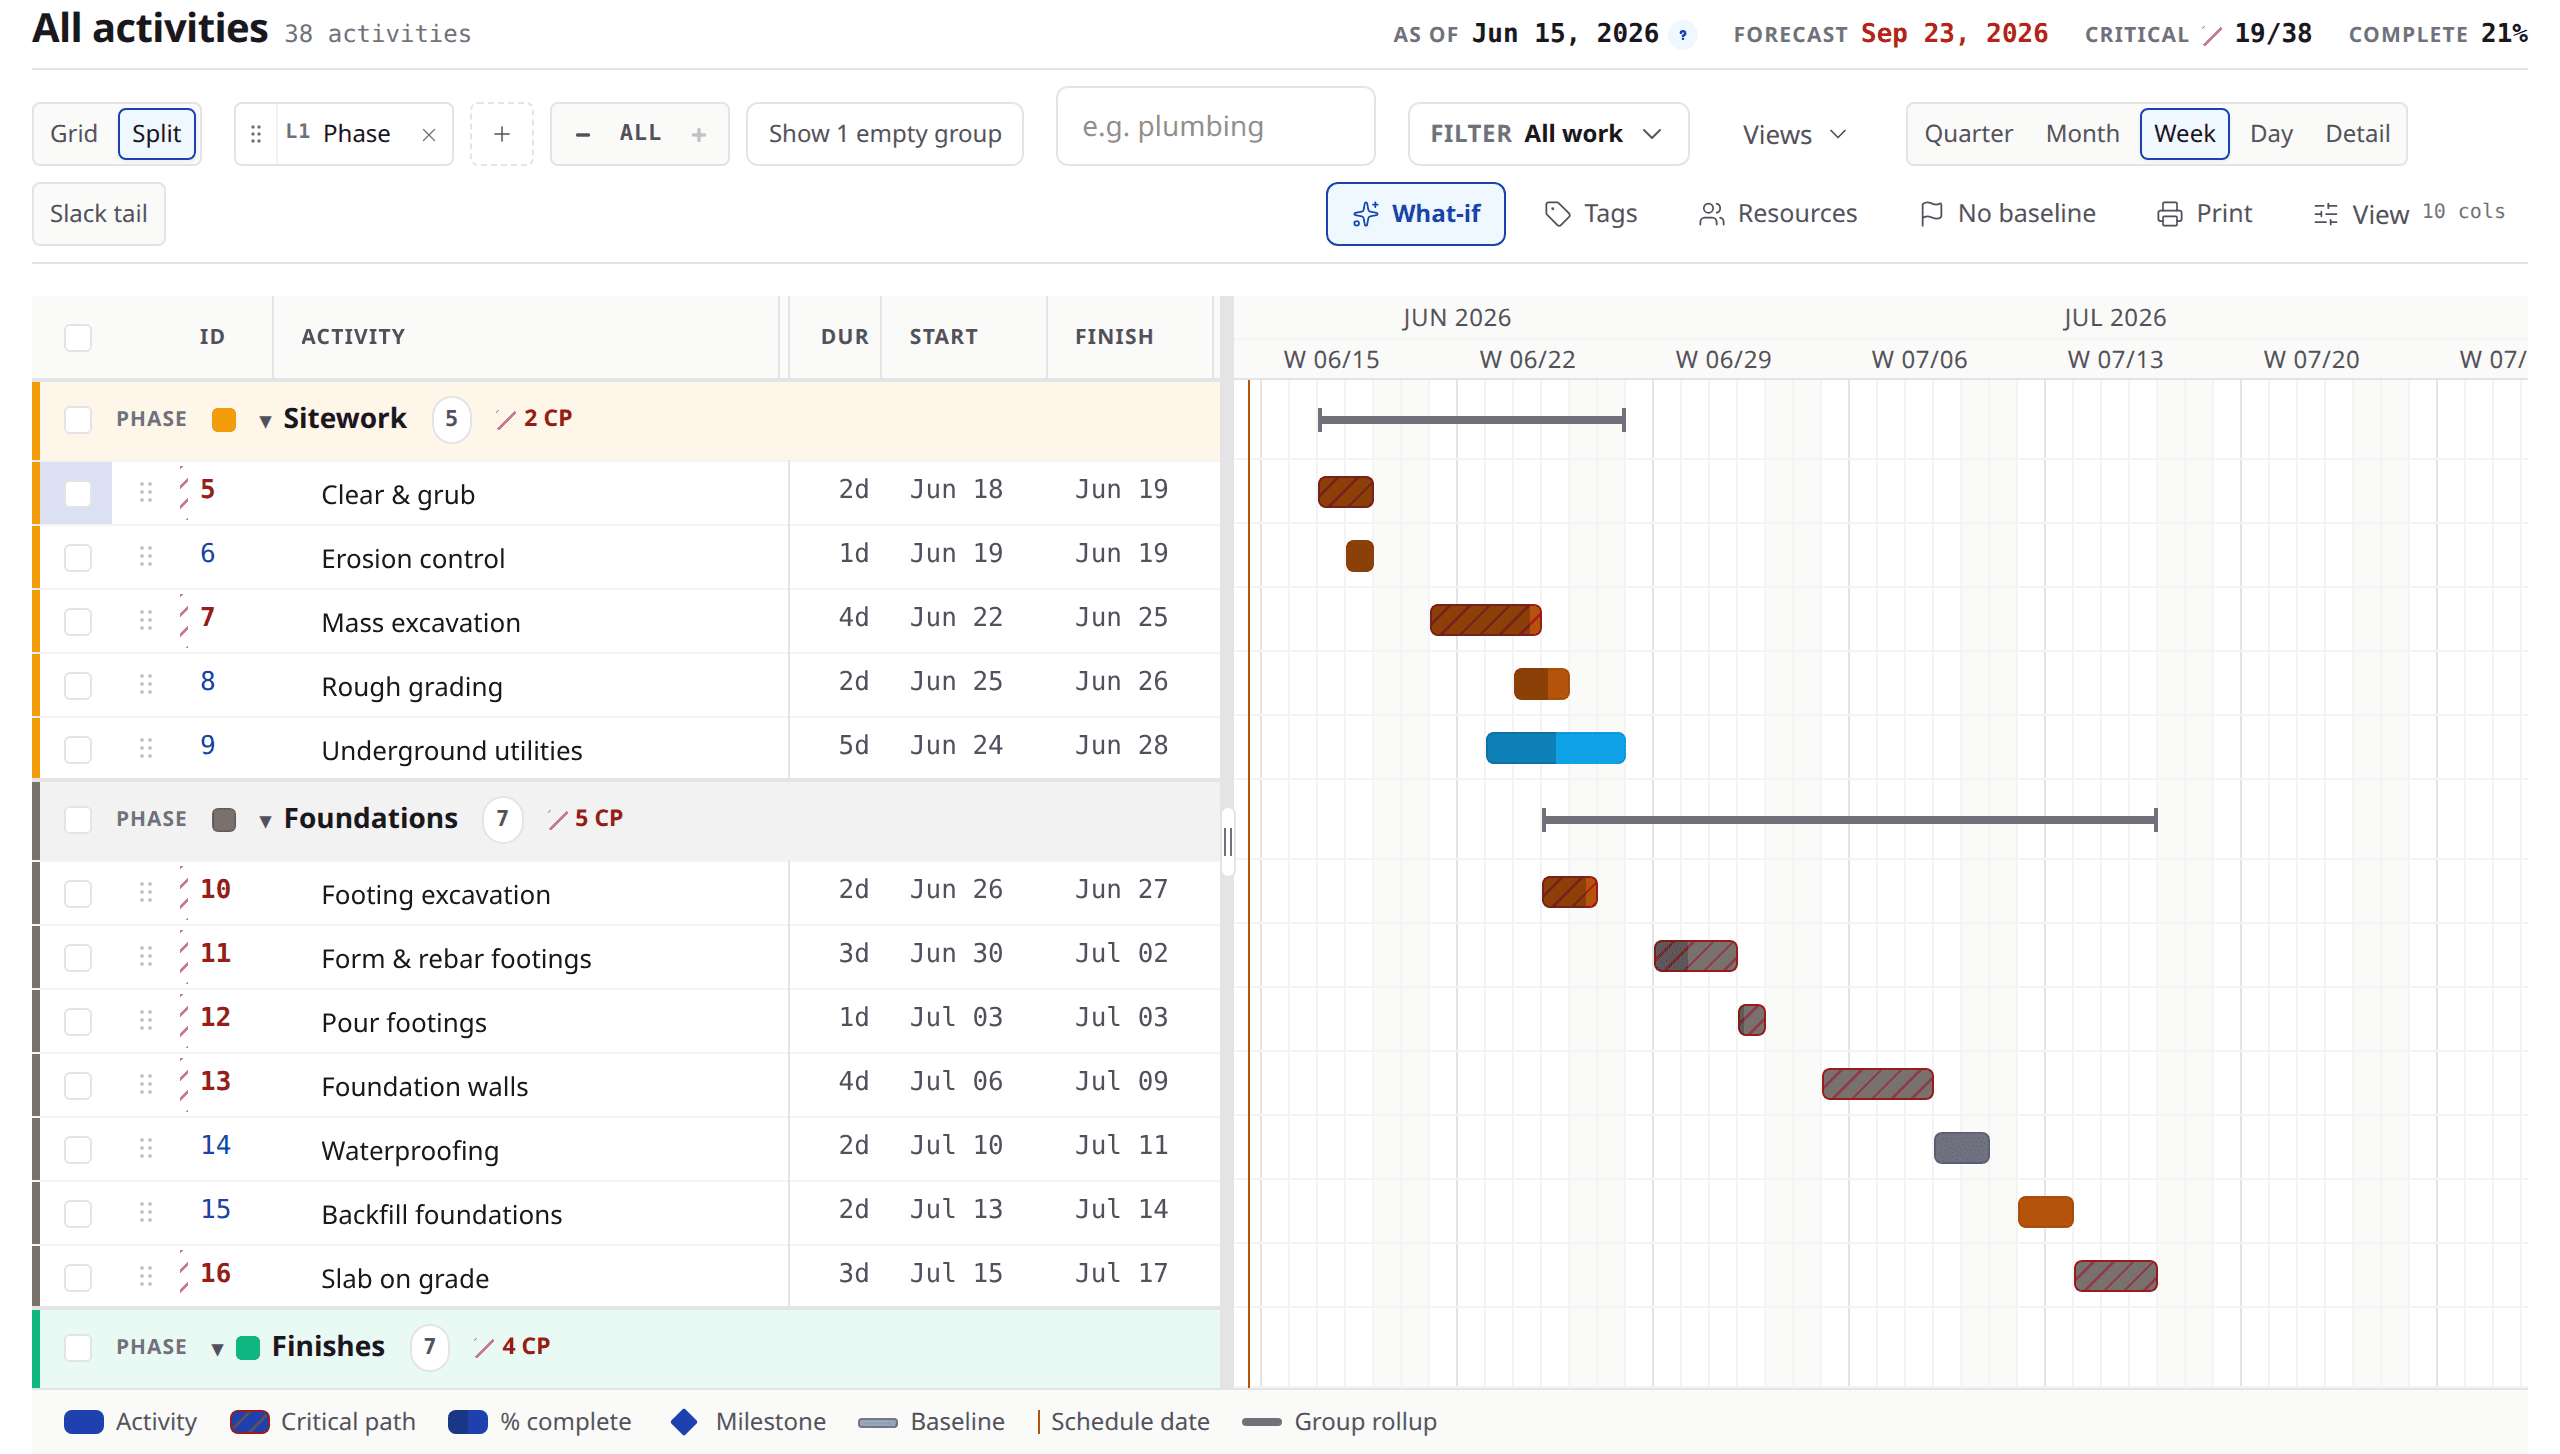
The grid
It behaves like the spreadsheet you left. The model underneath does not.
Everything a scheduler does forty times an hour — edit a duration, fill a column, paste a block, undo the last three things — works at the speed of typing, while every keystroke lands in a real critical-path model rather than in a cell.
The columns this job needs
Show what this job actually tracks and size each column to its content. You are not working around a fixed set of seven, and a column you resized stays that width in the view you saved.
Excel in, Excel out
Copy a block of cells out to a spreadsheet and paste one back in. Fill down and fill right work the way your hands already expect them to.
Undo that means it
Ctrl+Z across single-cell edits, fills and pastes. An edit that has not settled yet is queued and replayed rather than quietly lost.
Saved views
A view carries its columns, grouping, filters and sort together. Save it, name it, and hand it to the person who needs that particular slice.
Tags and dimensions
Slice the schedule by anything.
A schedule is not one outline. It is an area schedule to the superintendent, a trade schedule to the subcontractor, a procurement schedule to the buyer, and a phase schedule to the owner — all at once, from the same activities.
Build as many custom dimensions as the job actually needs — area, phase, trade, procurement, bid package, whatever you manage by — and tag an activity with as many as apply. There is no cap on how many dimensions a project carries or how many values a dimension holds.
Grouping that stacks
Group by area, then by trade, then by phase. Reorder the stack and the grid regroups around it — the same activities, a different question.
Filters that compose
Filters combine rather than replace one another, so narrowing to one area and one trade is one view, not two round trips.
Saved and shared
Save the whole arrangement as a view and hand it over. The person you send it to opens the slice you were looking at.
The Gantt
CPM scheduling that shows what is driving your date.
The grid and the Gantt are two panes over one model, split however you want them. Every bar, arrow and float value comes out of the engine run, so the picture and the numbers cannot disagree.
Critical work, and the links that drive it
An activity is critical when its total float is at or below zero — negative float included, so a constraint conflict stays in the set rather than dropping out of it. Driving is the separate per-link answer: the predecessor relationship that actually decided a successor's start carries the accent, and a tie makes every tied link driving. Neither is guessed from a bar's colour, so what the dates are resting on is on the screen rather than inferred.
Float, both kinds
Total float and free float per activity, from a real backward pass — with the late dates behind them, not a rule of thumb.
Baselines and variance
Capture a baseline and compare against it. More than one, because a job that has been re-baselined twice still has to answer questions about the first one.
Zoom from a day to a quarter
Move between day, week, month and quarter scales, with non-working days shaded so a bar that spans a shutdown week reads as what it is.
Scale and safety
A thousand activities, with two people typing at once.
Brikt is built for schedules at a thousand activities and more, open in front of several people on the same morning.
A thousand activities and more
Scrolling and typing stay responsive at 1,000+ activities — in the plain grid, in the grouped view and in the Gantt alike. Only the rows on screen are drawn, so the count being drawn stays bounded whether the schedule holds two hundred activities or two thousand.
Edit together, live
You can see who else is in the schedule, and their changes arrive without anyone refreshing. Real-time collaboration with presence, on the same model you are editing.
Nobody silently overwrites anyone
If someone changed the same field while you were typing, Brikt says so calmly and shows you what changed, rather than picking a winner and telling neither of you. Protection is per field, so two people can work the same activity at once.
Measured, not asserted
How long a full recalculation takes, and how we measured it.
A complete critical-path pass over a schedule of 1,000 activities, carrying 1,978 predecessor relationships, takes a median of 6.13 ms. At 10 times as many activities — 10,000 activities, 19,846 relationships — the same pass takes 109.76 ms. Both are medians across runs; the slower tail and the run-to-run spread are below.
That is the scheduling engine working: the forward pass, the backward pass, float, criticality and the schedule-health metrics, over the whole schedule. It is not the time from pressing a key to seeing a row move, which also includes a database, a network and a browser. We measure the engine because the engine is what we can measure honestly.
- What is being timed
- One complete run of the scheduling engine, in memory. No database read, no serialisation, no network call, no rendering.
- Method
- 10 warm-up iterations then 100 measured iterations, in each of 15 separate runs. Each run reports its own median and its own 95th percentile over those iterations; the figures published here are the medians of those across the runs — not a single percentile over every call, and not the best run. Figures are shown to the nearest hundredth of a millisecond; the unrounded values are in the record.
- Spread, and the slower tail
- At 1,000 activities the fastest run's median was 5.84 ms and the slowest was 7.87 ms; the median of the runs' 95th percentiles was 8.13 ms. At 10,000 activities, 103.96 ms to 120.27 ms, with a median of the runs' 95th percentiles of 125.81 ms.
- Machine, and what it was doing
- Intel(R) Xeon(R) Platinum 8488C, 4 cores, 8 logical processors, 31,554 MB RAM, Linux 6.17.0-1019-aws x64, Node v22.23.1, Vitest 4.1.10. Not an isolated benchmark host, so no run was allowed to start while the one-minute load average was above 8.00; across the runs it read 1.69 to 4.20.
- Schedule measured
- 1,000 activities, 1,978 predecessor relationships, 21 date constraints, 50 milestones, 1 calendar. The larger one is 10,000 activities and 19,846 relationships.
- Measured on
- 2026-08-07, at commit 21e0085e589b, from a clean checkout — so that commit contains the measuring code as well as the engine.
The schedule these numbers were taken on is a fixed file in our repository, so the run is re-runnable rather than described. Its checksum is 8b5a5b07147538e6246d320552f7446ed00282e007ac03feb044f195c0b2cf06. Every run behind the figures above is recorded beside it — its median, its 95th percentile and the load on the machine when it started — so each figure can be re-derived rather than taken on trust.
What is not here: a browser figure, a frame rate, and a time for a full round trip from your keyboard to the screen. We do not publish those because we do not measure them, and a number nobody measured is worth less than an admission.
Honest progress
Days left, not a percent somebody guessed at.
Percent complete can mean time elapsed, quantity installed or physical progress, and the column it goes in does not record which one you meant. Once the number is in the schedule the forecast is built on it anyway.
So Brikt asks for the other one. Your field says how many working days are left on the work in front of it — the number it actually has — and the engine takes the forecast from there. Percent complete is derived from remaining duration, in that direction and never the other one.
It is a small change in what gets typed and a large change in what the schedule is worth by month four.
Schedule health
The schedule tells you when it is drifting.
Thirteen of the DCMA 14-point checks run against your schedule — open ends, leads and lags, relationship types, hard constraints, high float, negative float, long durations, invalid dates and the critical path test, plus missed tasks, CPLI and BEI once you have captured a baseline — alongside Brikt’s own checks for out-of-sequence progress and duplicate logic. The fourteenth, resource checks, is not among them: Brikt has no resource-loading model to measure. Findings are surfaced for you to look at; Brikt does not grade your schedule.
A check that has nothing to measure says so. It never reports a comfortable zero it did not compute.
What-if and scenario analysis
Scenario analysis on the schedule itself, not on a copy of it.
What happens if the steel slips two weeks? Answering that honestly is the reason schedulers keep a folder of duplicate files — and the reason nobody is ever quite sure which one the last conversation was about.
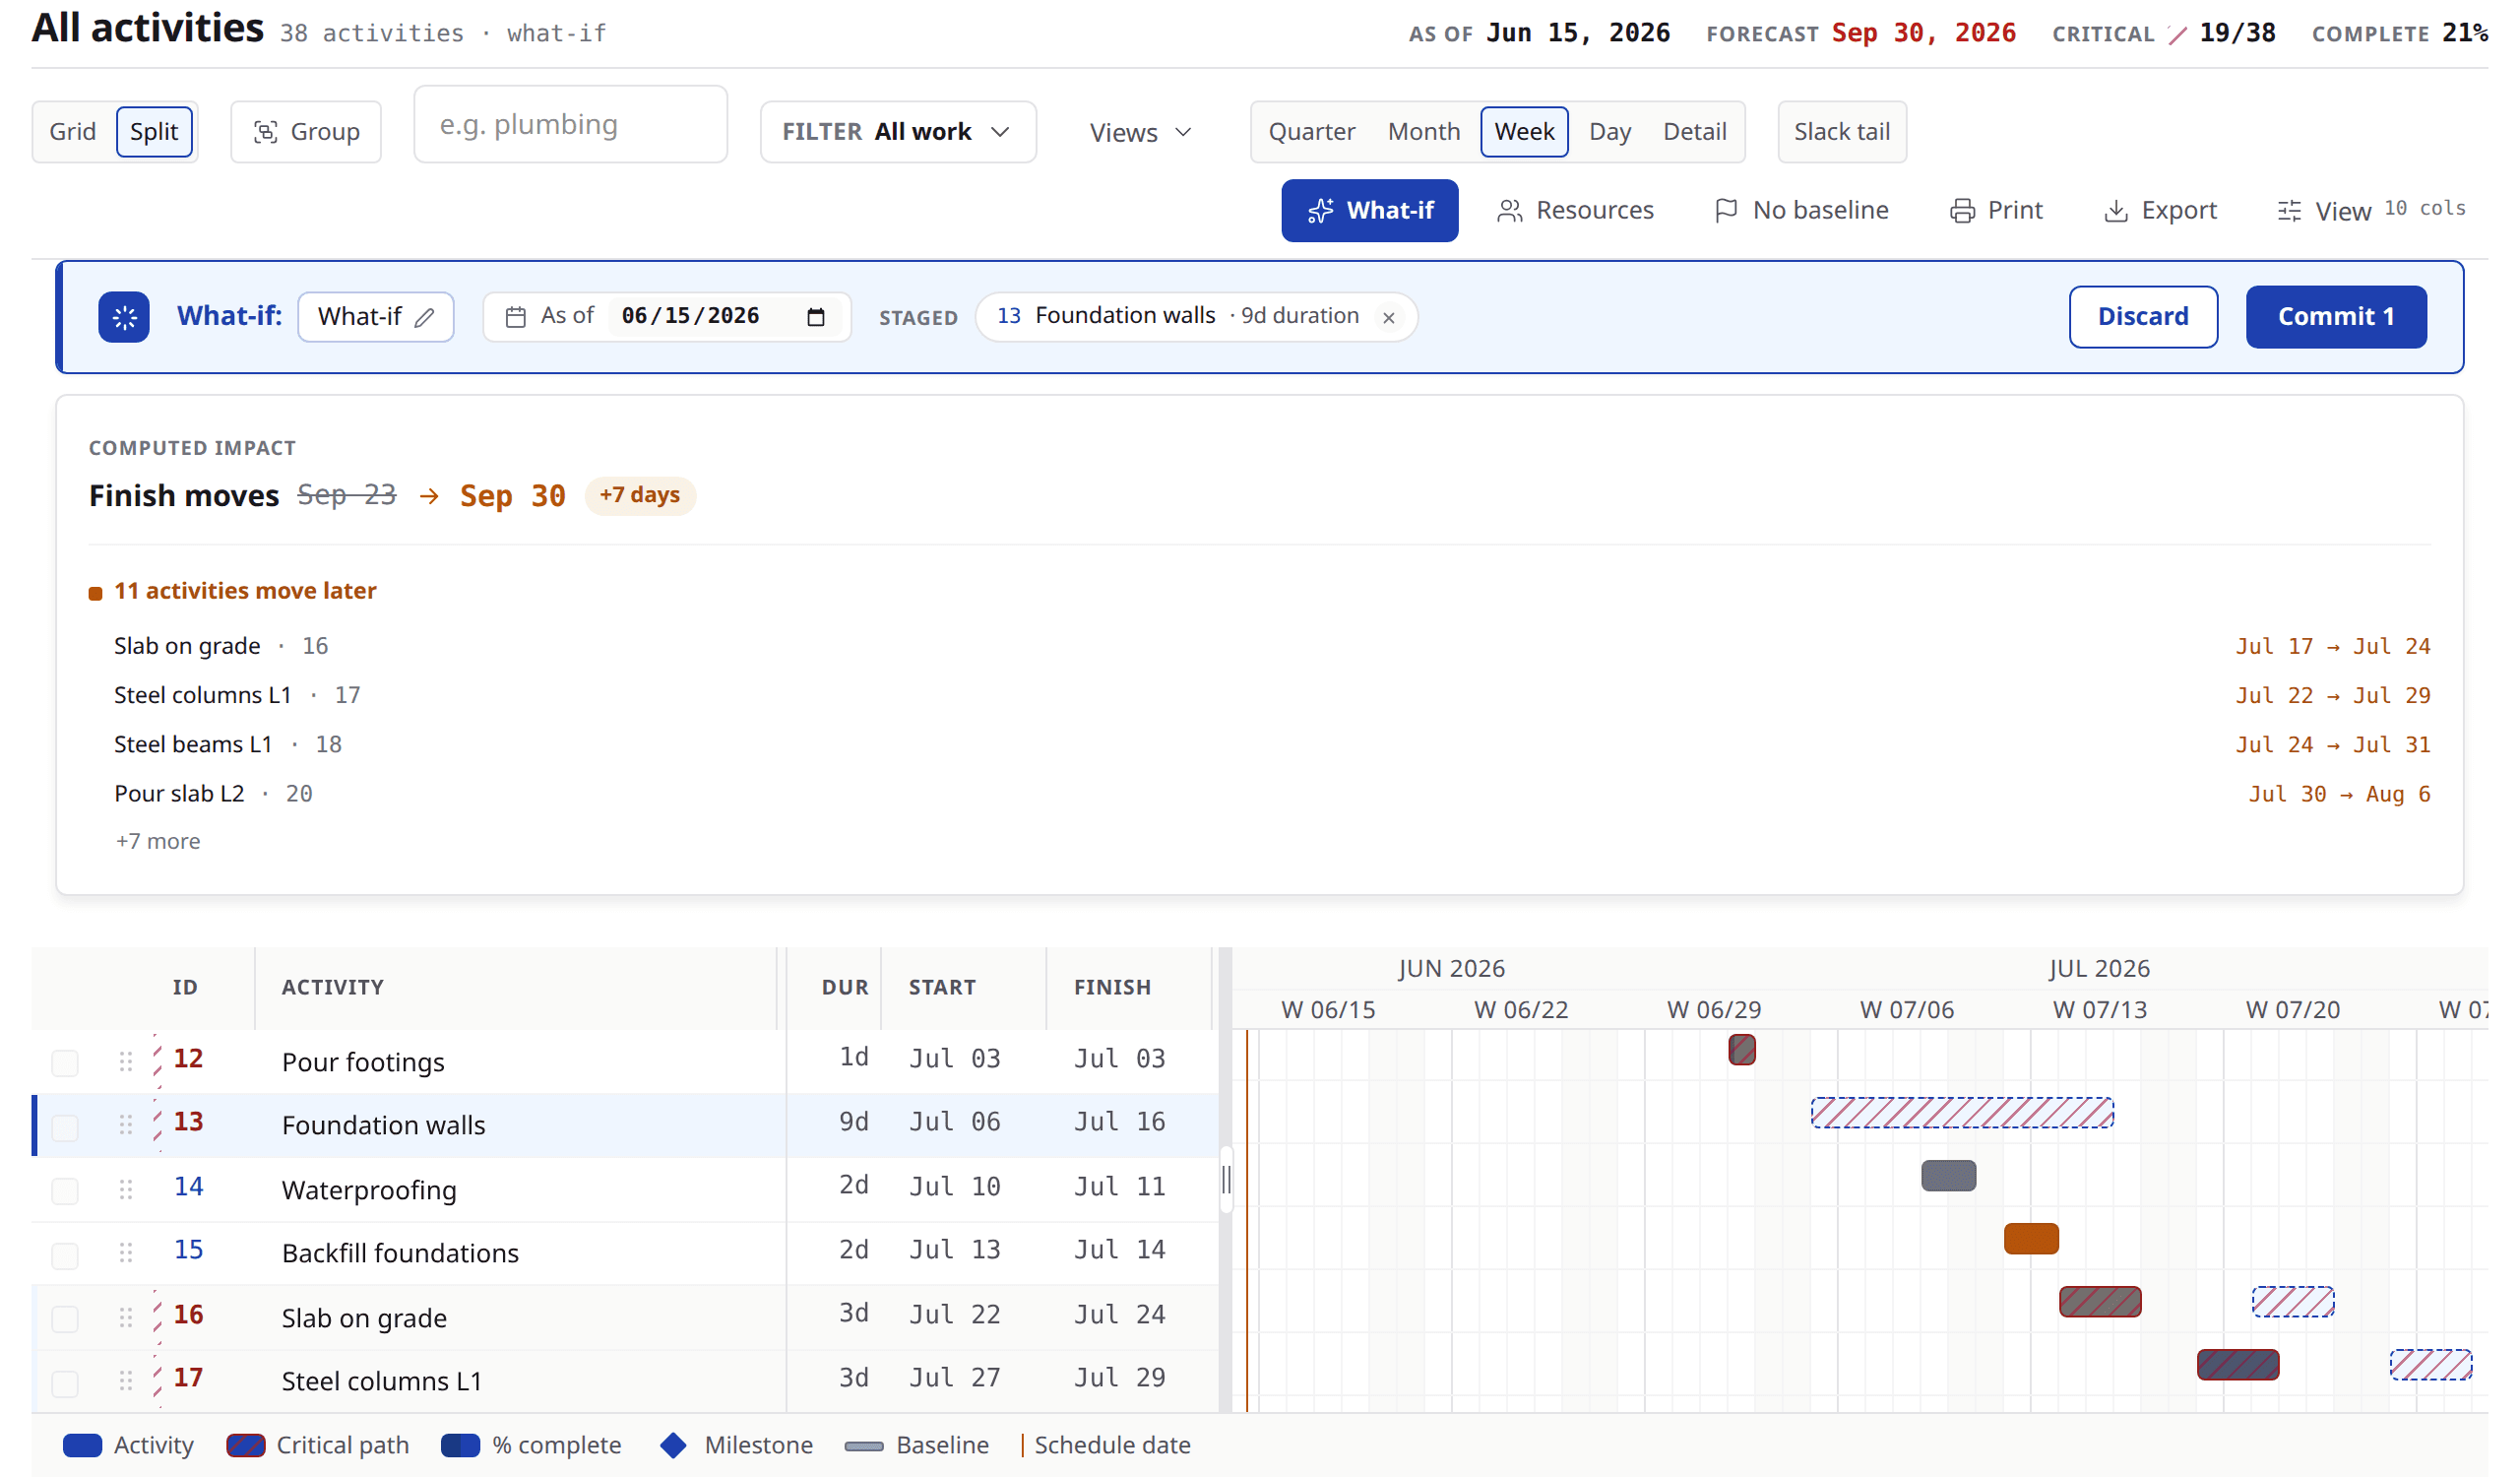
Stage the change on your real schedule instead. It runs against the same engine as the schedule, returning the dates the staged change would move under the current model: every activity that shifts behind it, and what it does to the finish. Then keep it or drop it — nothing is committed until you say so, and a discarded scenario leaves nothing behind.
See it on your own schedule.
Bring a job you are running now. We will open it in Brikt rather than showing you a demo project.